Introduction
The increasing demand for mobile broadband communication has led to the current roll-out of Long Term Evolution (LTE) [1] mobile networks. This roll-out attends a technological evolution from second generation and third generation network technology with separated voice and data paths towards a homogeneous IP based next generation mobile network. The building up and migration of such networks as well as the operation of the resulting network needs to be cost efficient and capable to satisfy the demanding Internet services like streaming video and social networking. Many technological options and migration paths are possible for this 2G/3G towards 4G network evolution and operators and vendors need to find out, which solution and which timing satisfy the roll-out objectives at minimal short-term and long-term cost. It is therefore necessary to model the incurred capital expenditures (CAPEX) [2] and operational expenditures (OPEX) [3] in order to estimate the total cost of ownership (TCO) [4] of the resulting setup. Within the European CELTIC project “MEVICO” [5], such a cost modelling is being developed alongside with the discussion of feasible topological and technological solutions. The described modelling approach below has been carried out within the scope of this project. The following sections describe the intention of the created model, its structure and calculation results as well as an outlook to a more complex approach to be followed up within the project.
2 Model aim
The techno-economic implications of the mobile network evolution towards LTE are very complex and require detailed analysis of the cost driving technical elements, the timing influence and the administrative and selling expenses. The resulting aim was to model the full value chain starting from the potential customer base, the market share (penetration) of the operator, the service demand being generated by the active subscriber base in the busy hour, the required LTE network equipment, the transport network elements in the access, backhaul and core network, the own and outsourced human resources, the licensing cost as well as the marketing expenses. To achieve a better understanding of the element dependencies, a rather simple example scenario has been tackled. Furthermore, a single LTE data service is being modelled with a setup fee and a monthly flat rate tariff for simplicity reasons. Based on this revenue generating service not only the network cost can be evaluated but also the long term profitability as expressed through the net present value (NPV) [6].
3 Model structure
The example scenario being modelled targets a fictive mobile network operator, who starts to deploy LTE data service in a rather small region -initially in three major cities followed by ten medium sized cities and lastly in 47 small cities. This service rollout is planned over seven years and the simulated time horizon of the model is chosen to be ten years. The modelling makes use of a business case analysis software called “Strategic Telecoms Evaluation Model (STEM)” [7]. The following subsections are going to describe major model parts in detail. The overall model structure is shown in Figure 1.
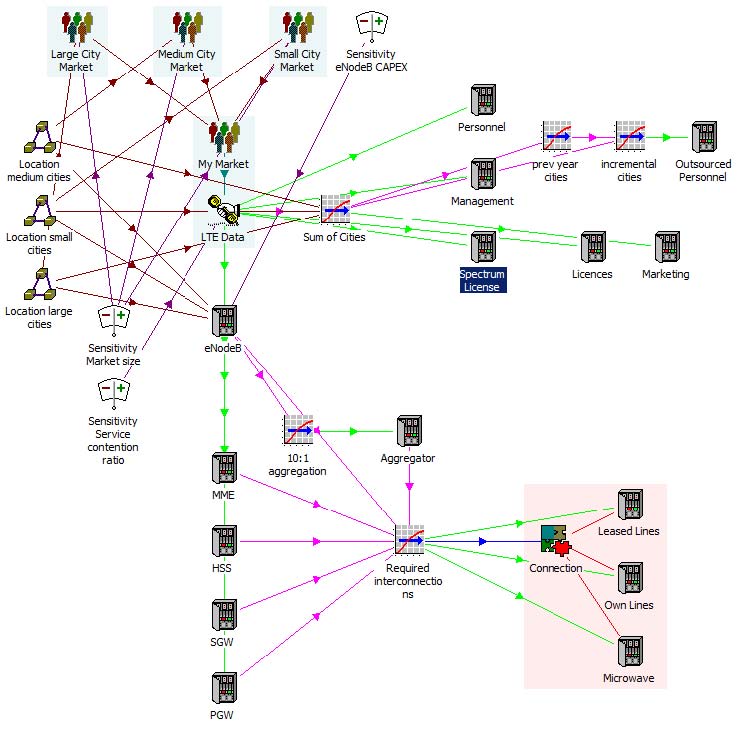
Figure 1 Model structure (LTE network example)
3.1 Modelling of the market
According to the assumed roll-out plan from large and medium to small cities and surroundings, the resulting market of potential LTE customers is based on the cumulative market population from those three city types being increasingly accessible over time (see Figure 2). The population is assumed to be 800.000, 100.000 and
30.000 inhabitants respectively.
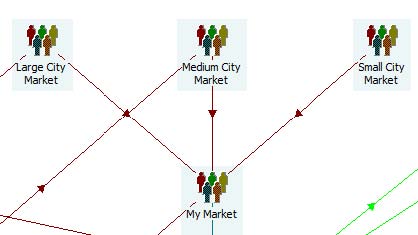
Figure 2 Cumulative market structure
The resulting overall market size is depicted in Figure 3.
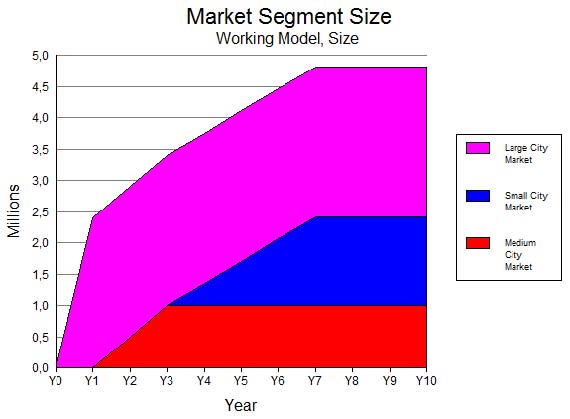
Figure 3 Potential customer base
The service uptake by the potential LTE customers is modelled using a S-curve penetration forecast reaching 80% penetration in year 10 (see Figure 4).
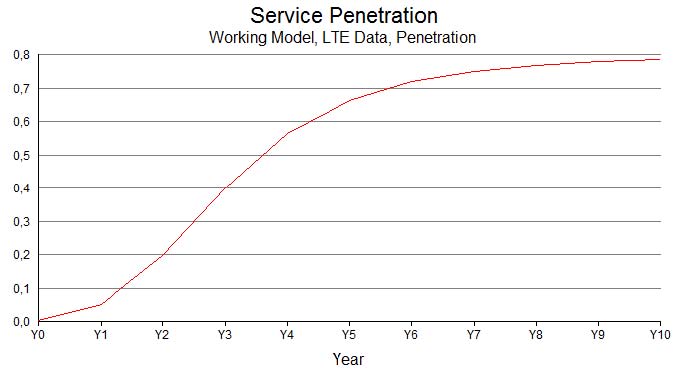
Figure 4 Market penetration in S-curve shape
3.2 Modelling of LTE data service
A single service is currently included in the model, which reflects on the predominant usage of LTE mobile networks for mobile Internet data service. Voice services – based on an IP Multimedia Subsystem (IMS) [8] control plane are not included in the example scenario and will be added in future extensions. Starting from the LTE customer base and the described service penetration, the traffic demand calculation is peak driven and concentrates on the assumed busy hour traffic given by a nominal bandwidth and a contention ratio. This ratio hereby defines the level of overbooking between the theoretical traffic demand as given by the nominal bandwidth and the active subscribers in the busy hour and the actually dimensioned traffic capacity of the network. A nominal bandwidth of 30 Mbps and a contention ratio of 20 have been assumed. As mentioned earlier, the LTE data service is being modelled with a setup fee of 60 EUR and a monthly flat rate tariff of 45 EUR. This extends the cost analysis by positive cash flow for the revenue and thus allows for profit calculations and NPV analysis.
3.3 Modelling of LTE equipment
In order to provide the LTE data service as described above, a number of basic network elements need to be deployed. This requirement is one input for the installed base of the LTE equipment, which is independent of the actual number of such elements required to carry the actual traffic or signalling demand. The list of such basic network resource elements is:
- BTS (Base Transceiver Station also known as eNodeB for LTE)
- MME (Mobility Management Entity)
- HSS (Home Subscriber Server)
- SGW (Serving Gateway)
- PGW (PDN Gateway)
• Spectrum Licence Each resource element has an assumed capacity to serve incoming traffic demand. The replacement of devices is modelled by a physical lifetime with the assumption, that the replacement installs the same type of equipment again. This mechanism is particularly valuable for the long term cost evaluation in the life cycle of the mobile network. On the associated cost input for each resource, the capital cost for the initial investment, the operations cost for the maintenance as well as the residual value, the churn and decommissioning cost in case of device replacement can be modelled. For simplicity reasons, the following analysis is focused on the capital cost for CAPEX and the operations cost for OPEX only.
3.4 Modelling of the transport network
The transport of LTE traffic from the eNodeBs towards the Serving Gateway is assumed to happen in an aggregated tree like transport network. Accordingly some aggregation devices are modelled along the path, which aggregate on a ratio of 10:1 in transport capacity. Furthermore, large portions of the access network are assumed to be implemented using microwave link technology, whereas the aggregation and core network lines are either leased lines or owned fibre connections. A split of 50% microwave and fixed lines and equal distribution between owned and leased lines has been assumed behind the aggregator node. Figure 5 depicts the modelling section for the transport network on the right hand side.
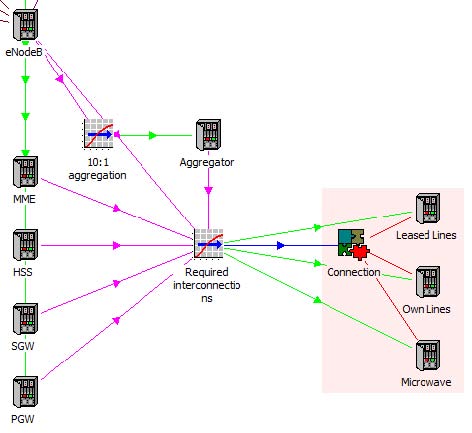
Figure 5 LTE elements and transport resources
3.5 Modelling of administrative and selling expenses
Besides the specific cost elements for network equipment, the administration, staff and marketing expenses should be taken into account as well in order to model the overall cost structure of the network operation. Figure 6 depicts some of such general resources being considered in the cost modelling.
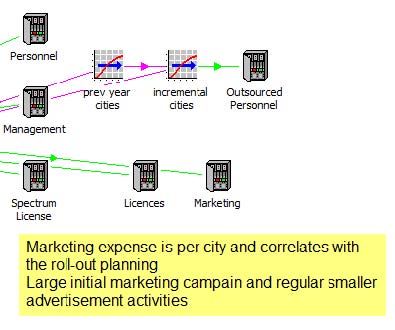
Figure 6 More general operating expenses
One special distinction has been made between “own” personnel, which is permanently hired and responsible for configuration and maintenance of the network (permanent OPEX) and outsourced personnel, which is hired on demand with fixed pricing for the equipment roll-out phase in the respective roll-out area (non-recurring installation cost).
4 Modelling results
The simulation run of the established LTE network model yields many detailed reports on the technical as well as financial parameters and internal calculation results. The following subsections will document a small selection of such reports.
4.1 Traffic demand report
Based on the potential LTE customer base as given in Figure 3 and the assumed service market penetration as shown in Figure 4, the number of active connections in the busy hour (see Figure 7) and the resulting busy hour traffic (see Figure 8) is being reported.
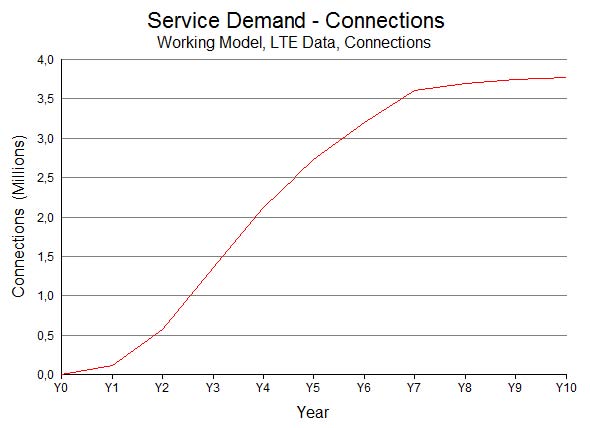
Figure 7 Number of active connections
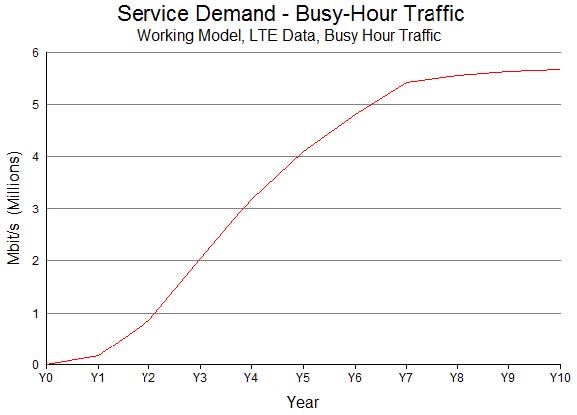
Figure 8 Traffic demand – busy hour traffic
4.2 Installed units report
The modelled traffic demand needs to be met by the required resource elements of the LTE data service and leads to the respective installation base of the equipment resources. Each element had been given its capacity value and will be installed several times to meet the demand. This in turn leads to reports about installed units over time. However, since the capacities of serving gateways, PDN gateways, HSS and MME devices outperform the required capacity values in this small simulation, only single instances of such devices are reported. The overall report of installed equipment of each type can be seen as part of the report in Figure 9 shown in bold continuous lines. Figure 9, however, gives even more insight depicting the expired (long dashed line) and incrementally installed (short dashed line) units. This way, one can estimate the incremental effort required over time to commission the required equipment under the rising traffic demand and concurrently physically expiring network elements. As shown in the figure below, eNodeBs (BTS) and aggregation elements by far outnumber the remaining element types.
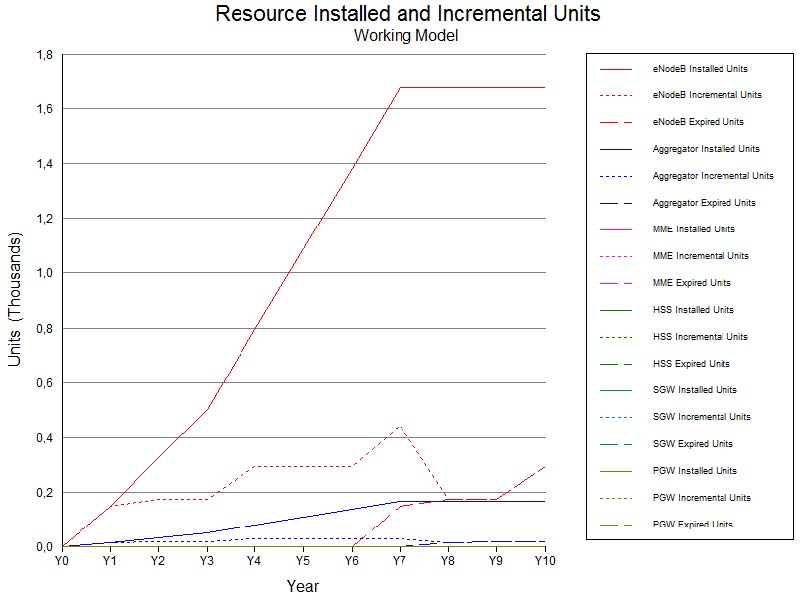
Figure 9 Installed and incremental resource units
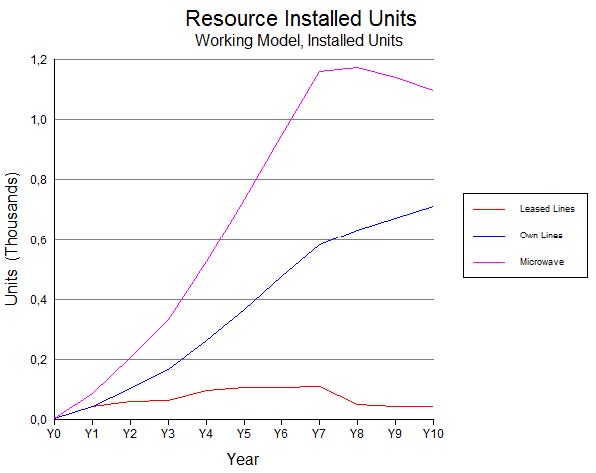
An equivalent report can be created on the installed units of transmission lines as depicted in Figure 10. Here the predominant technology is microwave due to the many transport links of this type in the access network tree. However, it can be shown, that leased lines and microwave links fall in numbers as the installation of own fibre connections advances.
4.3 CAPEX report
Capital expenditures are long lived investments in goods and real estate, which are normally being depreciated in the financial statements over several years. Figure 11 depicts a typical example of the CAPEX investment in LTE specific equipment. It can be seen that cost for eNodeBs (BTS) and aggregators dominate heavily and the remaining elements are hardly to be seen in the diagram. Moreover, this figure also reveals that the highest CAPEX investment is forecasted for year seven, which is a valuable insight for the financing planning of the venture.
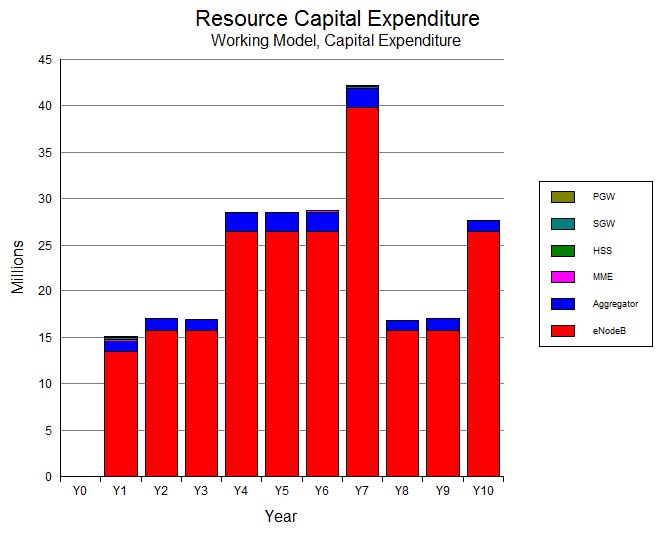
Figure 11 CAPEX of LTE specific resources
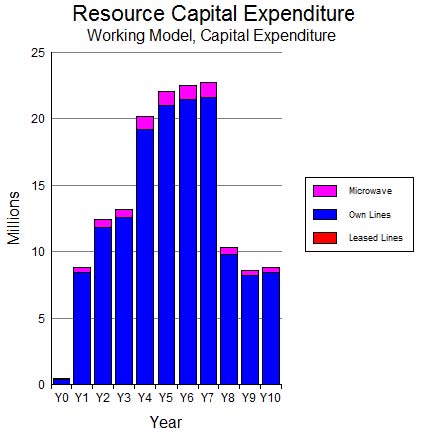
Similarly, the installation of microwave and fibre links holds CAPEX costs, which are shown in Figure 12. The leased lines cost (coloured in red) are nil, since this is regarded as annually recurring OPEX cost.
The overall CAPEX report is depicted in Figure 13
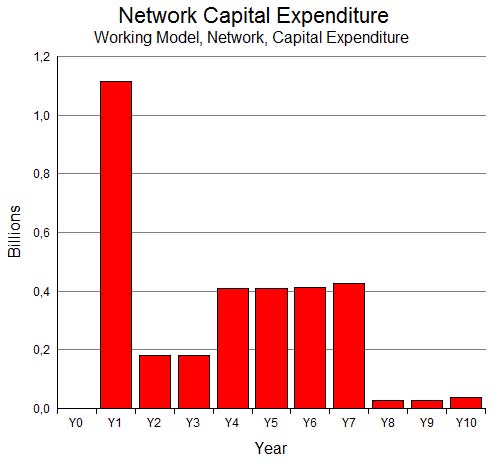
Figure 13 Overall CAPEX report
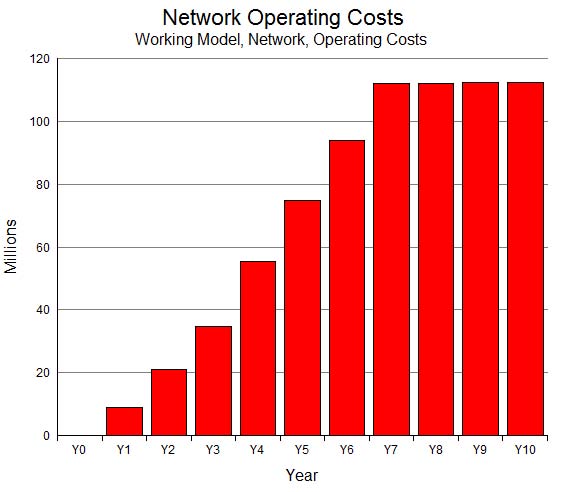
4.4 OPEX report
Operational expenditures are short lived expenditures, which are required for the operation of the network. It encompasses cost of annual licences, marketing, wages, etc. The following figures depict the respective OPEX cost for such annual fees as well as the maintenance cost of the installed units (such as spare parts and expenditure for site inspection, etc.).
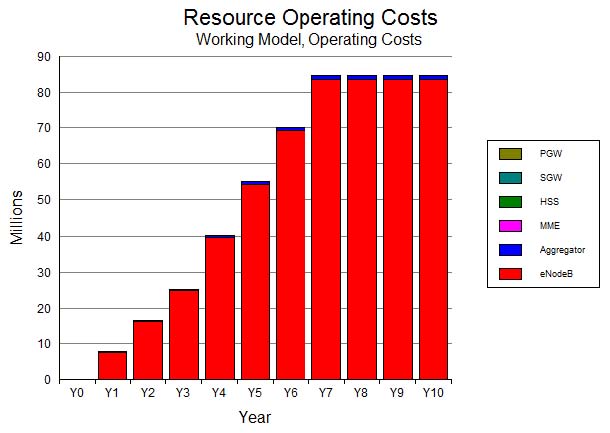
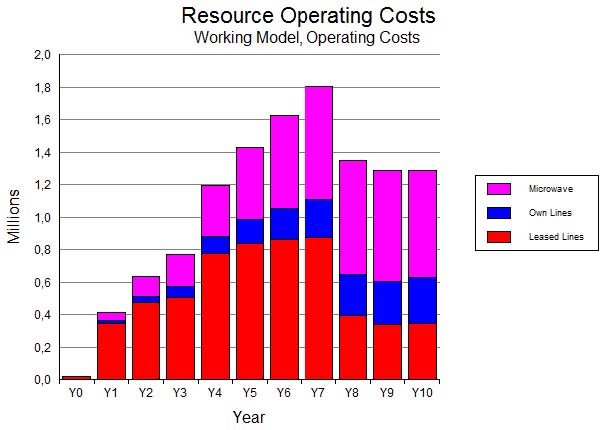
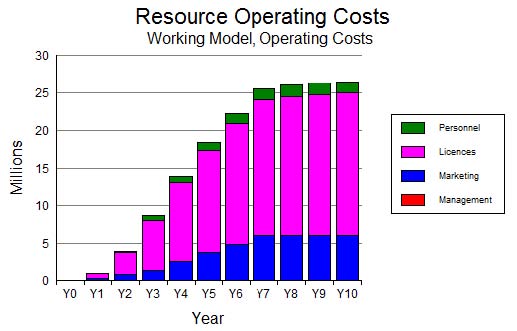
The overall OPEX report is depicted in Figure 17.
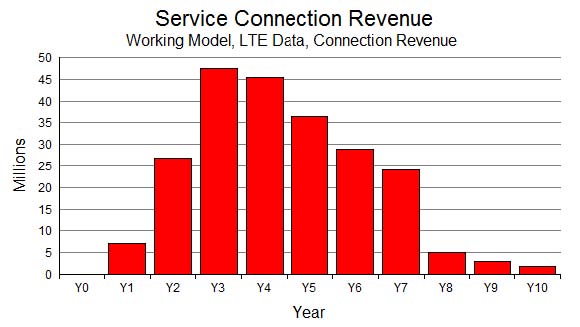
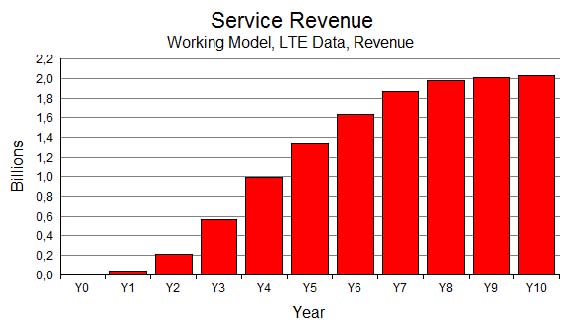
4.5 Revenue and NPV report
Since the model includes a tariff for the offered service, revenue is generated according to the service uptake by the subscribers and their monthly flat rate fee. The respective connection and flat rate revenue is shown in Figure 18 and Figure 19.
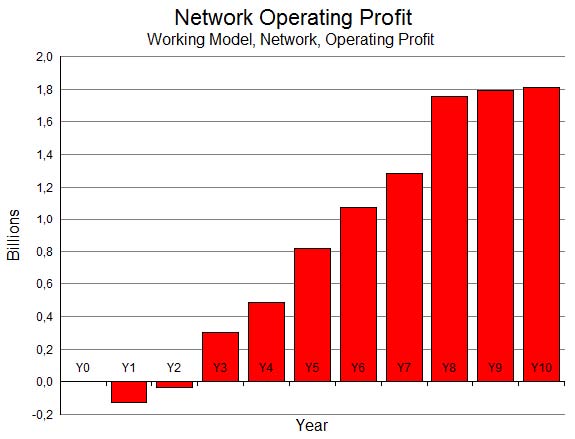
Under the given assumptions, the network operation is becoming profitable in year three as shown in Figure 20.
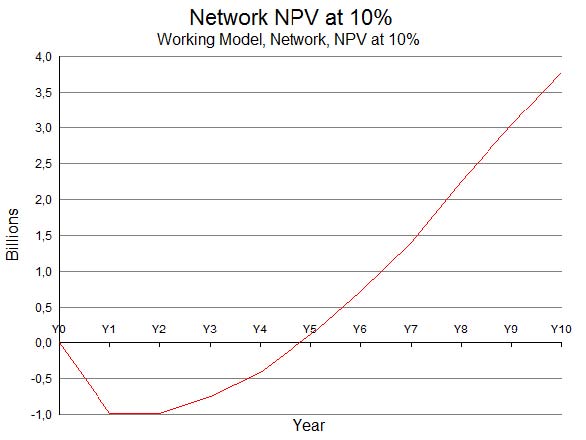
The similar trend is also documented in the 10% NPV report as depicted in Figure 21.
4.6 Sensitivity analysis
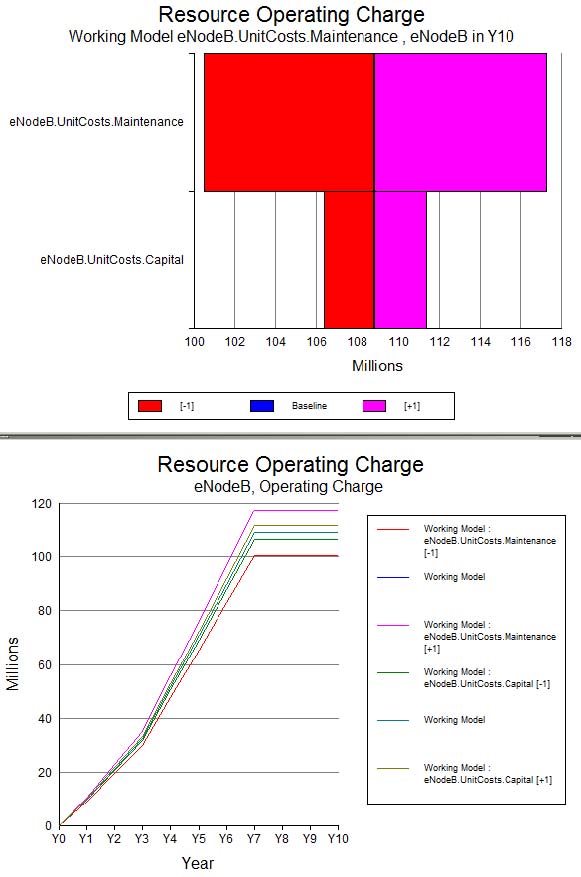
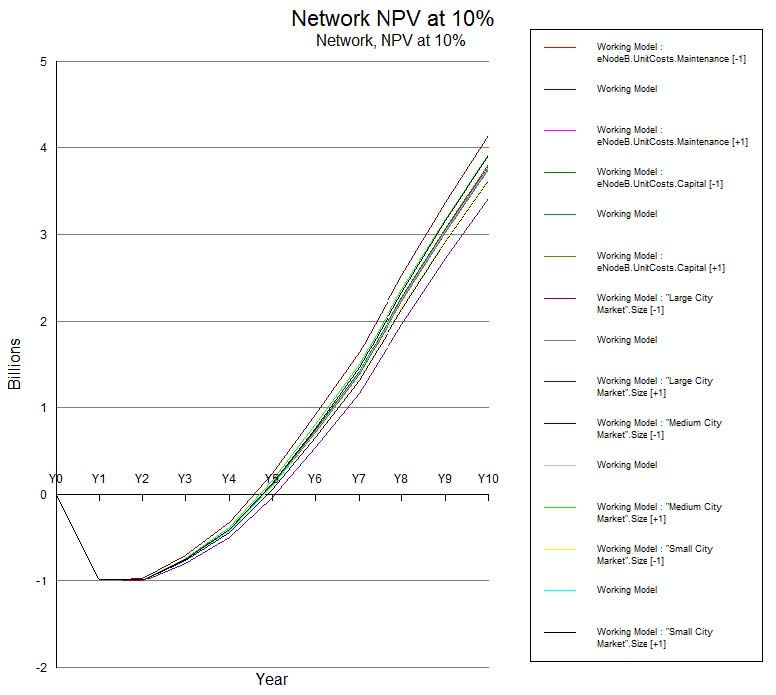
The modelled demand and cost parameters are based on assumptions and forecast values. This naturally includes uncertainty and could potentially lead to wrong modelling results. In order to challenge the model with varying parameters, the sensitivity analysis is used to determine the impact of input parameter changes onto output results. This way, the most influential parameters can be derived and in turn modelled in more rigorous accuracy. Exemplarily, the parameters for eNodeB capital and maintenance expenditures are varied by +/-10% of uncertainty, which yields the output as shown in Figure 22.
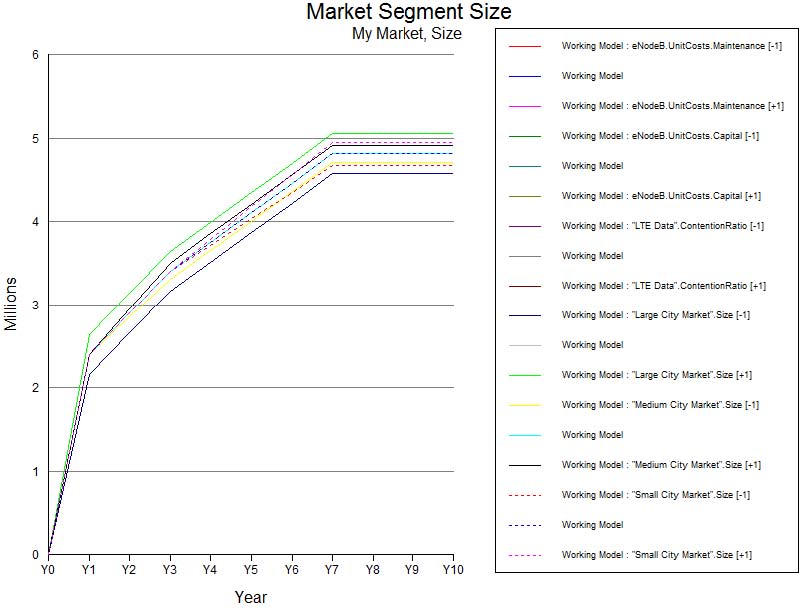
As a second example, a +/-10% uncertainty in the market size of all city types varied independently results in the following figures (Figure 23 and Figure 24).
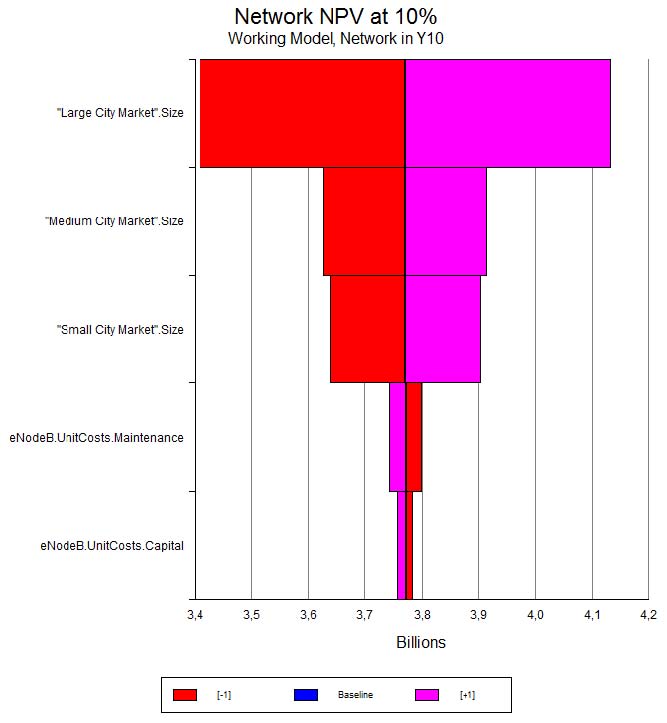
In order to base management decisions, supply chain trade decisions as well as to concentrate market research efforts onto the most influential system inputs of the mobile network venture, one should combine the separate sensitivity analysis results into one diagram sorted by decreasing impact. Figure 25 exemplarily depicts such an so called “tornado graph” combining the sensitivity results for varied eNodeB CAPEX and OPEX as well as the market size forecast uncertainty.